In any modern application ecosystem, monitoring is vital for ensuring smooth operations and proactive issue resolution. Within the Power Platform, where components like custom plugins, Power Automate flows, JavaScript in Dynamics 365, and Power Apps solutions work in unison, effective monitoring can mean the difference between a seamless user experience and costly downtime. This is where Azure Monitor steps in, with Azure Application Insights serving as a powerful ally for comprehensive, real-time data tracking.
Why Monitoring Matters
The following points highlight why monitoring is essential for ensuring seamless operations, empowering teams to continuously optimize their systems and driving long-term success.
1. Proactive Issue Detection: By observing application events, telemetry, and performance metrics, you can detect anomalies before they lead to downtime.
2. Reduced Mean Time to Resolution (MTTR): Detailed logging and alerts let you zero in on the root cause quickly, minimizing the time your system spends in a vulnerable state.
3. Continuous Improvement: Monitoring insights help you optimize resource usage, refine your architecture, and enhance user satisfaction.
4. Enhanced Reliability: With timely alerts and dashboards, teams can react faster to potential disruptions, mitigating damage and safeguarding mission-critical operations.
Azure Monitor & Application Insights
Azure Monitor is a comprehensive solution for monitoring the performance and availability of applications, infrastructure, and networks by collecting and analyzing telemetry data. Application Insights, part of Azure Monitor, is specifically designed to monitor applications, detect errors, analyze performance, and track user experience. It provides a detailed view of application behavior in real time, helping to continuously optimize applications.

- Real-Time Metrics: Track requests, response times, exceptions, and custom events.
- Proactive Alerts: Get notified when performance thresholds or error rates exceed defined limits.
- AI-Powered Diagnostics: Leverage AI-driven insights to spot anomalies and pinpoint causes more rapidly.
- Seamless Integration: With connectors in the Power Platform, sending telemetry to Application Insights is straightforward for both code-based and low-code projects.
Using Azure Monitor in Plugins, Flows, and JavaScript (Dynamics 365 & Power Apps)
1. Plugins in Dynamics 365
With Azure Application Insights integration you have the possibility to log any action from you C# Plugins. Weather, it an error or something different that you want to track, you can do it. The example below, shows you how to implement such behavior, sending logs from the Plugin to Azure App Isights.
Assumption : Instrumentation Key is stored as an Environment Variable.
- Install and Configure the SDK: Reference the Microsoft.ApplicationInsights NuGet package in your plugin project.
- Initialize TelemetryClient: Add your Instrumentation Key (often called Connection String) in the plugin’s constructor or configuration.
- Send Custom Events: Within your plugin code, you can log specific events or exceptions:
- Monitor in Azure: In the Azure portal, you’ll see events, performance metrics, and error details streaming in real time.
using System;
using System.Text;
using Microsoft.Xrm.Sdk;
using Microsoft.ApplicationInsights;
using Microsoft.ApplicationInsights.Extensibility;
using Microsoft.Xrm.Sdk.Query;
public class MyAppInsightsPlugin : IPlugin
{
private readonly TelemetryClient telemetryClient;
// Contructor of the Plugin
public MyAppInsightsPlugin(string unsecureConfig, string secureConfig)
{
var instrumentationKey = GetEnvironmentVariable("APPINSIGHTS_INSTRUMENTATIONKEY");
if (string.IsNullOrEmpty(instrumentationKey))
{
throw new InvalidPluginExecutionException("Instrumentation Key for Application Insights is missing from environment variables.");
}
var telemetryConfig = TelemetryConfiguration.CreateDefault();
telemetryConfig.InstrumentationKey = instrumentationKey;
telemetryClient = new TelemetryClient(telemetryConfig);
}
// Execute Method, Runs when event is triggered (ex: creation, update ...)
public void Execute(IServiceProvider serviceProvider)
{
ITracingService tracingService = (ITracingService)serviceProvider.GetService(typeof(ITracingService));
IPluginExecutionContext context = (IPluginExecutionContext)serviceProvider.GetService(typeof(IPluginExecutionContext));
IOrganizationServiceFactory serviceFactory = (IOrganizationServiceFactory)serviceProvider.GetService(typeof(IOrganizationServiceFactory));
IOrganizationService service = serviceFactory.CreateOrganizationService(context.UserId);
try
{
tracingService.Trace("Plugin Execution Started");
Entity targetEntity = (Entity)context.InputParameters["Target"];
if (targetEntity.LogicalName == "account")
{
telemetryClient.TrackEvent("Account Created", new Dictionary
{
{ "AccountId", targetEntity.Id.ToString() },
{ "UserId", context.UserId.ToString() },
{ "MessageName", context.MessageName }
});
telemetryClient.TrackTrace($"Account created with ID: {targetEntity.Id}"); // Writes Message in Azure App Insights
}
tracingService.Trace("Plugin Execution Finished Successfully"); // Writes Message in Plug-In Trace Logs
}
catch (Exception ex)
{
tracingService.Trace($"Exception: {ex.Message}"); // Writes Message in Plug-In Trace Logs
telemetryClient.TrackException(ex); // Writes Message in Azure App Insights
throw new InvalidPluginExecutionException($"An error occurred: {ex.Message}");
}
}
// Retrieve a Power PLatform Environment Variable value knowing its name
private string GetEnvironmentVariable(string variableName)
{
IOrganizationService service = (IOrganizationService)ServiceLocator.GetService(typeof(IOrganizationService));
QueryExpression query = new QueryExpression("environmentvariablevalue") { ColumnSet = new ColumnSet("value") };
query.Criteria.AddCondition("schemaname", ConditionOperator.Equal, variableName);
EntityCollection result = service.RetrieveMultiple(query);
if (result.Entities.Count > 0)
{
return result.Entities[0]["value"].ToString();
}
else
{
throw new InvalidPluginExecutionException($"Environment variable '{variableName}' is not set.");
}
}
}
2. Power Automate Flows
Most of the time when uging Dynamics 365, Cloud Flows run in the background and are not manually trigger. But it's still important to log for the same reasons mentionned above.
To Write a message in App Insights from Power Automate, you can follow the steps below :
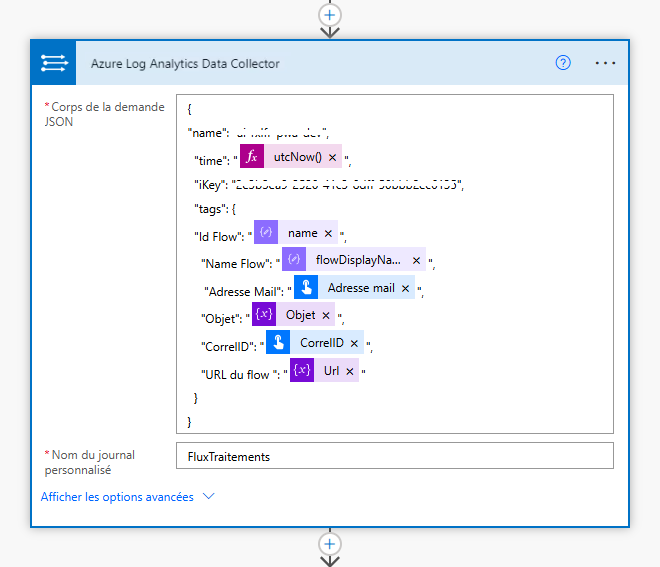
- Use the Azure Log Analytis Data Collector Connector: Microsoft provides this connector which allows you to log data directly from a Flow to the log analytics workspace.
- Custom Log Logic: When a flow step completes (or fails), add an action with the connector mentionned above to capture relevant data (e.g., run status, parameters used).
- Scheduled Monitoring: Implement a nightly or hourly flow that checks system health or logs operational stats (like the number of records processed). This data can then appear in your Application Insights dashboards for further analysis.

3. JavaScript in Dynamics 365 and Model-Driven Apps
In your forms, you also have the possibility to track different types of events using Application Insights. To do so, you can go ahead and use the Javascript SDK for Azure App Insights.
- Insert Telemetry Code: In your web resources, add the Application Insights JavaScript snippet.
- Init the App Insights Instance
- Track Events or Page Views
- Handling Exceptions: Wrap key logic in try-catch blocks and send exceptions to Application Insights:
- Analyze User Interactions: The logged events can reveal which forms or components are used most and how error-free those experiences are.
The example script below can be attached to the onload event of a form, and will Track page view as well as Track a custom event.
function logToAppInsights(executionContext) {
// Azure Application Insights Instrumentation Key
var instrumentationKey = "YOUR_INSTRUMENTATION_KEY";
// Initializing the App Insights Object
var appInsights = window.appInsights || (function(config) {
function s(config) { t[config] = function() { var i = arguments; t.queue.push(function() { t[config].apply(t, i); }); }; }
var t = { config: config }, r = document, f = window, e = "script", o = r.createElement(e), i, u;
for (o.src = config.url || "https://js.monitor.azure.com/scripts/b/ai.2.min.js", r.getElementsByTagName(e)[0].parentNode.appendChild(o), t.queue = [], i = ["Event", "Exception", "Metric", "PageView", "Trace", "DependencyData", "Flush"], u = 0; u < i.length; u++) s("track" + i[u]);
return t;
})({ instrumentationKey: instrumentationKey });
window.appInsights = appInsights;
appInsights.trackPageView();
// Custom logs
var formContext = executionContext.getFormContext();
var accountId = formContext.data.entity.getId();
appInsights.trackEvent("Account Form Loaded", {
AccountId: accountId,
User: Xrm.Utility.getGlobalContext().userSettings.userName
});
console.log("Account Form Loaded - Log sent to Application Insights");
}
You can also so better than just log events, you can also track exceptions from JavaScript using the same SDK, like this example below :
try {
// Some critical operation
} catch (ex) {
appInsights.trackException({ exception: ex });
}
4. Canvas Apps and Power Apps Portals
- Use the Power Apps Monitoring Features: Canvas apps can leverage built-in monitoring for performance and errors. You can also incorporate custom connectors that send events to Azure Monitor.
- Track Events in Portals: For web-based Power Apps Portals, embed Application Insights JavaScript to capture user behavior and troubleshoot issues.
Best Practices
- Plan Alert Thresholds: Define what constitutes normal versus critical conditions for response times, error rates, or usage patterns.
- Ensure Security and Compliance: Validate that any logged data meets compliance and privacy requirements, avoiding personal data where not appropriate.
- Regularly Review Dashboards: Actively monitor Application Insights dashboards to catch issues early, rather than waiting for user complaints.
- Automate Incident Management: Integrate with Azure DevOps or other ticketing systems to automatically create work items when critical alerts fire.
- Combine with Other Services: Leverage Log Analytics for advanced querying and Power BI for data visualization.
Conclusion
With the Power Platform continuing to grow in scope and complexity, robust monitoring has never been more important. Azure Monitor and Application Insights provide a holistic, versatile way to track performance, detect errors, and maintain a proactive stance on system health. Whether you’re customizing plugins, automating workflows with Power Automate, or embedding JavaScript in Dynamics 365 and Power Apps, integrating these tools can significantly reduce downtime and improve user satisfaction. By setting up real-time alerts, leveraging analytics, and following best practices, your Power Platform solutions will remain resilient, optimized, and ready to scale.


 Français
 English